
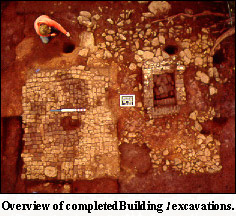
 Building l was described by Jefferson in his 1796 insurance plat as a "a house 16. by 10 1/2 feet, of wood, used as a storehouse for nailrod & other iron." Excavations revealed a "platform" of flooring material composed of a brick pad to the east and a prepared stone and clay mixture to the west. Taken together, the floors roughly outline a structure 10.5 by 16 feet. A mortared brick box feature measuring 3 by 4 feet was uncovered in the southern portion of the rock and clay floor. This feature appears to be a foundation for a small metalworking forge. No postholes were found, indicating a building made of log construction.
Reassessing the Building l site
In 1999, the Building l site was the first Mulberry Row site to be restudied in detail (Scholnick et al. 2000). Among the principle issues we hoped the Building l site reassessment would clarify is the changing character of site use over time. The presence of large quantities of ceramics and animal bone in the excavated assemblage indicate Building l was the site of a domestic occupation of considerable duration and intensity. On the other hand, large quantities of nail rod and the presence of a brick forge foundation in the structure indicate that the building was also used for nail making and perhaps blacksmithing. The 1796 Mutual Assurance Plat points to a third use as a storehouse for iron. Were these functions simultaneous or consecutive?
Several factors make getting an answer to this question a challenge. Producing a defensible answer from archaeological data depends on the existence of deposits that contain artifact assemblages from successive periods of site occupation, the recognition of these time-transgressive deposits by the original excavators, and the presence of representative samples of artifact in the deposits.
 The 1979-81 excavators did recognize stratification within the site. Artifacts from each excavated quadrat were provenienced in multiple contexts. Within a single quadrat, the excavators defined separate contexts at successively lower depths, hoping that the boundaries between contexts matched the interfaces between deposits. Thanks to their care, it is possible to determine whether their excavated contexts contain assemblages that sample temporally successive periods of the site's occupation.
The first step in the re-evaluation of stratigraphy from Building l is the summary of the stratigraphic relationships between contexts, as defined by the original excavators. This is accomplished using an analytical diagram called a Harris matrix. The Harris matrix illustrates the vertical "before and after" relationships, as well as the horizontal "equal to" and "contemporary" relationships of the contexts and groupings of contexts (Harris 1979).
The resulting Harris matrix is shown above. Each excavated context is represented by a rectangle; vertical lines connecting contexts indicate an above/below relationship, while two horizontal lines denote that the two contexts are either contemporary or equal. (The exceptions are the two large rectangles in the top center section and is the result of combining the topsoil and disturbed contexts (i.e., backfill).) The graphic shows visually that the relationships between contexts within quadrats are known and were explicitly documented by the original excavators. There is a general lack, however, of horizontal connections for contexts in different quadrats. The Harris matrix generated from the excavators's observations is not sufficient to answer questions concerning the changing character of site use over time at Building l. The matrix does not offer a site-wide chronology that integrates the contexts into a sensible narrative of depositional events.
To build a chronology for the site that incorporates more contexts, we must look beyond stratigraphy. An alternative is a chronology of individual contexts, based on dating the ceramic assemblages they contain. We used frequency seriation for this purpose. The seriation method is based on the assumption that the relative frequency of each ceramic type exhibits a battleship-shaped curve through time. Thus the order of assemblages in which the expected battleship curves are best approximated by the frequencies of all the types is the order most likely to be a chronology (Dunnell 1970).
 Another Road to a Chronology: Seriation
We took a statistical approach to the problem of estimating the order of assemblages that fits the seriation model. Correspondence Analysis (CA) (Baxter 1994) is a multivariate statistical technique that is well suited to this purpose. The basic idea behind CA is to replace a complex, multi-dimensional data matrix with a much simpler, low-dimensional representation that captures as much of the original information as possible.
CA offers a numerical indication of the extent to which the pattern of inter-assemblage similarity really is one-dimensional, as is implied by the seriation model. The measure is the proportion of variation, or inertia in CA jargon, in the original dataset that is accounted for by the dimension scores. A high inertia value for the first dimension (and sometimes for the second dimension as well - see e.g. Neiman and Alcock 1995), is an indication that the assemblages can be ordered so that the type frequencies display battleship-shaped curves.
A potential pitfall with seriating assemblages from individual contexts is the issue of sample size. Assemblages from individual contexts will be small. As a result, sampling error is likely to obscure much of the chronological signal that lies behind the type frequencies. We have attempted to mitigate the distorting effects of small samples using Bayesian methods to improve our estimates of type frequencies (Robertson 1999). The basic idea here is a simple one. It is that our best guess about the frequency of a given ceramic type, say creamware, in a context, ought to take into account not only what was in that context, but also our prior knowledge about what was likely to have been found. Bayesian methods use our prior beliefs about what type frequencies are likely to occur in a sample to improve our posterior estimates of the type frequencies in the population from which the sample was taken. In this case the sample is the ceramic assemblage from a specific context, while the population is the larger hypothetical assemblage from which the few sherds that context were drawn.
Validating the Seriation Chronology
Once the posterior estimates of ceramic type frequencies in the 32 assemblages had been computed, they were analyzed using CA. The first CA dimension accounted for 42 percent of the variation (inertia) in the data matrix. The fact that the second dimension accounted for a scant 13 percent is a good indication that the structure behind the ceramic ware frequencies is essentially one-dimensional. It also suggests that the distributions of some type frequencies along that dimension roughly fit the battleship model. Does this dimension represent time? To answer this question, we computed mean ceramic dates (MCD) for the 32 assemblages, using the posterior type frequency estimates. The correlation between the MCDs and CA first-dimension scores was surprisingly high (Pearson's r= .94, Spearman's r=.92 and Kendall's Jb=.78). The high correlation with the MCDs provides strong independent evidence that CA has successfully extracted a previously unknown chronological signal from these data.
Assemblage Analysis
With the chronology in hand, it is now possible to address issues of change over time in the use of the site as a domestic versus an industrial facility. Was Building l used as a house and then a nail factory or vice versa or were these simultaneous? To answer these questions, we examined the abundance of domestic artifacts relative to industrial artifacts in each of the seriated contexts. We used three measures of the relative abundance of domestic artifacts based on ceramics, faunal remains and bottle glass. For each of these we used two measures of abundance, one based on artifact counts, the other based on artifact weights.
Ceramic Index
Our first estimate of the frequency of domestic versus industrial activity at the site is the Ceramic Index (ceramics/(ceramics+nailrod)). This scatter plot shows Ceramic Index values based on counts and weights in each of the seriated contexts. To highlight trends in these noisy data, we used locally weighted regression (Cleveland 1993). Loess estimates of the trends are represented by the continuous lines. Both the count and weight data suggest a general decrease in the abundance of ceramics relative to nailrod. The fitted loess line hints at a short-lived increase in ceramic abundance during the middle of the occupation.
Faunal Index
Our second estimate of the frequency of domestic versus industrial activity is the Faunal Index (faunal material/(faunal material+nailrod)). The loess fitted trend lines show a general decline in faunal material deposition relative to nailrod. Note the disproportionate bulge in the faunal weights during the middle of the occupation.

Bottle Glass Index
The last estimate of the frequency of domestic versus industrial activity at the site is the Bottle Glass Index (bottle glass/(bottle glass+nailrod)). Once again, we see a decrease in the abundance of bottle glass relative to nailrod, punctuated by a reversal of this trend during the middle of the occupation.
Conclusion
The loess fitted trend lines for all three Artifact Indices have a similar pattern showing an increase and then a decrease in the intensity of industrial relative to domestic activity through time. The agreement between the three Indices is remarkable given the small artifact sample size for many of the excavated contexts. Because many of the later contexts were removed without trace in 1957, our conclusions are tentative. However, it is clear that Building l was more than simply a "storehouse for iron."
The causes of the oscillations in industrial and domestic are currently unknown. One possibility is change over time in the scale of nail manufacturing at Monticello, driven by change in its profitability relative to other sources of income. Another is change in the location of nail manufacturing. Evaluation of these possibilities will require similar chronological control on nail manufacturing at other Monticello sites, in particular the nailery on Mulberry Row (Building j) and the recently discovered naileries in the agricultural fields on the eastern slopes of Monticello Mountain (Sites 15 and 18). Although the archaeological record offers limited temporal resolution, there is no evidence for discrete phases of industrial and domestic usage at Building l. Rather, domestic and industrial activity appears to have been synchronous. This fits the pattern at urban Chesapeake sites, for example Williamsburg, where slaves commonly lived in the same spaces that they worked.
Our seriation-based approach has important implications for the future study of the rest of the Mulberry Row sites excavated in the 1980s. Even if stratigraphic analysis of the sort attempted at Building l fails for other sites, it will still be possible to build intra-site chronologies using the seriation-based methods outlined above. And this in turn opens the door to the systematic archaeological study of change over time in the lifeways of Mulberry Row's inhabitants.
References
Baxter, M. J.
1994 Exploratory Multivariate Analysis in Archaeology. Edinburgh University Press, Edinburgh.
Cleveland, W. S.
1993 Visualizing Data. Hobart Press, Summit, New Jersey.
Dunnell, R. C.
1970 Seriation method and its evaluation. American Antiquity 35:305-319.
Harris, E. C.
1979 Principles of Archaeological Stratigraphy. Academic Press, London.
Neiman, F. D. and N. W. Alcock
1995 Archaeological Seriation by Correspondence Analysis: An Application to Historical Documents. In History and Computing 7(1):1-21.
Robertson, I.G.
1999 Spatial and multivariate analysis, random sampling error, and analytical noise: empirical Bayesian methods at Teotihuacan, Mexico. American Antiquity 64(1):137-152.
Scholnick, J., D. Wheeler and F. Neiman
2001 Mulberry Row Reassessment: The Building l Site. Manuscript on File, Archaeology Department, Monticello, Charlottesville, Virginia.